
B. Prusak's model
Method of calculation

gdzie:
Model description
Model (P1) developed by B. Prusak consists of 4 ratios illustrating firm's efficiency and profitability, as well as financial liquidity.
Interpretation of the Z(P1)-score
- Z(P1) = -0.13 - critical value (bankruptcy threat for the function below the critical value)
- Z(P1) ≤ -0.13 - "bankrupt" (distress zone)
- -0.13 < Z(P1) ≤ 0.65 - "grey zone" (no reliable prediction possible)
- Z(P1) > 0.65 - "non-bankrupt" (safe zone)
- Model fit: 94.87% (the model correctly classified the examined companies for one year in advance).
- The higher is the Z(P1) function (above 0.65), the better is the financial situation of a company and the lower is the bankruptcy threat within the forthcoming year.
- The increase of Z(P1) over time indicates the improvement of financial situation and decrease of bankruptcy threat.
- In the case of the Z(P1) < -0.13 (which signalizes bankruptcy threat) it is recommended to run a detailed analysis of financial performance to detect which aspects require an immediate healing procedures.
Detailed description of respective ratios and their impact on the Z(P1)-score value
Constant value -1.5685
The constant, free factor results from statistical estimates when building the model, it allows setting the limit value of Z(P1).
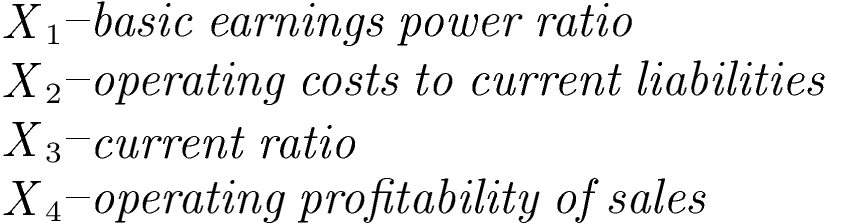
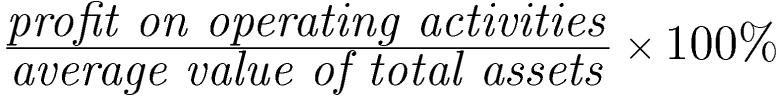
X1 – basic earnings power ratio
Method of calculation
Ratio's weight: +6.5245
Units: %
Remarks
The ratio is partially calculated like the basic earnings power ratio available in the eanaliza.pl system in the group of profitability ratios, but in the denominator we take the average value of total assets: (initial value at the beginning of the period + final value at the end of period) / 2.
Warning: the value for the first period (first column in the table) is equal to the total assets from the current period, as the value for the previous period is not available.
Ratio's interpretation
- A higher value of the ratio means greater ability of the company to generate operating profit based on its resources (assets).
- In the model, the ratio X1 has the highest weight with a positive sign, which means that the increase in the ratio (increase in profitability) will significantly increase the value of the function Z(P1).
- In case of a negative result (financial loss), the ratio X1 will decrease the value of the Z(P1) function, increasing the risk of bankruptcy.
X2 – operating costs to current liabilities
Method of calculation

Ratio's weight: +0.148
Units: times
Remarks
The ratio is built according to the original formula by B. Prusak.
To calculate it we take in:
- the numerator the operating expenses (position B in the comparative version of PaLS),
- the denominator the average value of short-term liabilities without special funds: (initial value at the beginning of the period + final value at the end of period) / 2.
Warning: the value for the first period (first column in the table) is equal to the total assets from the current period, as the value for the previous period is not available.
Ratio's interpretation
- Ratio X2 illustrates the relationship between the level of operating costs and current liabilities.
- In the model, an increase in X2 ratio, by assigning a positive weight, leads to an increase in the value of the Z(P1) function, which reduces the risk of bankruptcy .
- A higher value of the ratio means a higher level of liquidity and better financial situation, which reduces the risk of bankruptcy.
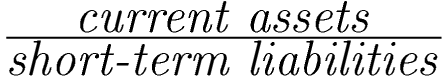
X3 – current ratio
Method of calculation
Ratio's weight: +0.4061
Units: times
Remarks
The ratio is calculated like the current ratio available in the group of liquidity ratios. It uses the data for the current period.
Ratio's interpretation
- In the model, the X3 ratio has a weight with a positive sign, which means that increase in the ratio, will increase the Z(P1) function, reducing the bankruptcy risk.
- A higher value of the ratio means greater ability of the company to generate operating profit based on sales revenues.
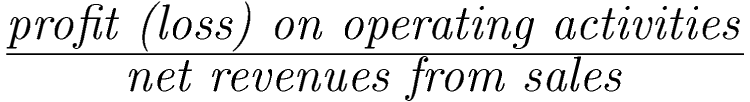
X4 – operating profitability of sales
Method of calculation
Ratio's weight: +2.1754
Units: times
Remarks
The ratio is built according to the original formula by B. Prusak. It uses the data for the current period.
To calculate it we take in:
- the numerator the profit/loss on operating activities (position F in the comparative version of PaLS),
- the denominator the net revenues from sales (position A in the comparative version of PaLS).
Ratio's interpretation
- In the model, the ratio X4 has high weight with a positive sign, which means that the increase in the ratio (increase in profitability) will significantly increase the value of the function Z(P1).
- In case of a negative result (financial loss), the ratio X4 will decrease the value of the Z(P1) function, increasing the risk of bankruptcy.