
E. Maczynska's model
Method of calculation

where:
Model description
Model developed by E. Mączyńska consists of 5 financial ratios that reflect company's profitability, efficiency of its operating activity, financial liquidity, capital structure and ability to cover debt.
Interpretation of the Z(M)-score
- Z(M)= 0 - critical value (bankruptcy threat for the function below the critical value)
- Z(M) ≤ 0 - "bankrupt" (distress zone)
- Z(M) > 0 - "non-bankrupt" (safe zone)
- Model fit: 95% (the model correctly classified 95.08% of the examined companies).
- The higher is the Z(M) function (0.1 and more), the better is the financial situation of a company and the lower is the bankruptcy threat within the forthcoming year.
- The increase of Z(M) over time indicates the improvement of financial situation and decrease of bankruptcy threat.
- In the case of the Z(M) below critical value 0, which signalizes bankruptcy threat, it is recommended to run a detailed analysis of financial performance to detect which aspects require an immediate healing procedures .
Detailed description of respective ratios and their impact on the Z(M)-score value
Constant value -2.478
The constant, free factor results from statistical estimates when building the model, it allows setting the limit value of Z(M) at the level of zero.
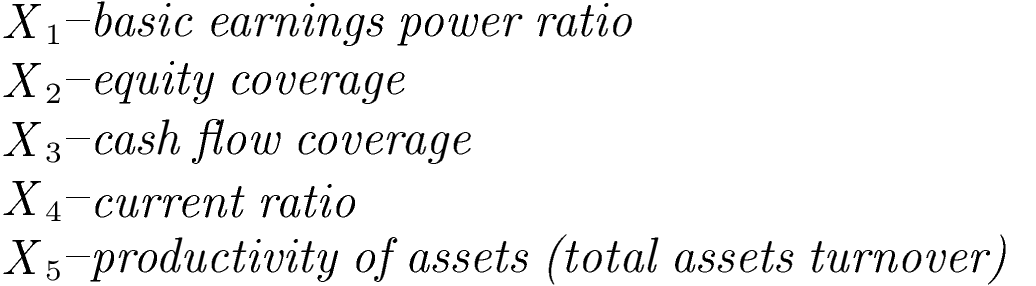
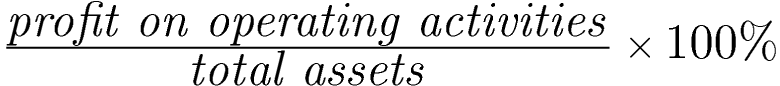
X1 – basic earnings power ratio
Method of calculation
Ratio's weight: +9.478
Units: %
Remarks
The ratio is calculated like the basic earnings power ratio available in the eanaliza.pl system in the group of profitability ratios. It uses the data for the current period.
Ratio's interpretation
- A higher value of the ratio means greater ability of the company to generate operating profit based on its resources (assets).
- In the model, the ratio X1 has the highest weight with a positive sign, which means that the increase in the ratio (increase in profitability) will significantly increase the value of the function Z(M).
- In case of a negative result (financial loss), the ratio X1 will decrease the value of the Z(M) function, increasing the risk of bankruptcy.
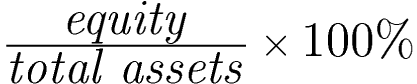
X2 – equity coverage
Method of calculation
Ratio's weight: +3.613
Units: %
Remarks
The ratio is calculated like the equity ratio available in the eanaliza.pl system in the group of debt management ratios. It uses the data for the current period.
Ratio's interpretation
- A higher value of the ratio means higher level of equity capital in financing assets, which improves firm's stability and long-term solvency.
- Higher level of equity capital reduces the bankruptcy risk, by reducing the level of liabilities .
- Increase in ratio X2, leads to increase in the Z(M) function, improving the financial situation of a company .
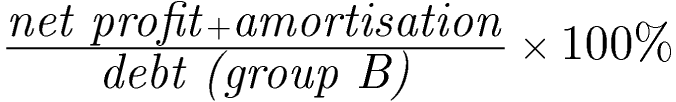
X3 – cash flow coverage
Method of calculation
Ratio's weight: +3.246
Units: %
Ratio's interpretation
- A higher value of the ratio means higher ability of a firm to cover debt (liabilities) with generated cash flow (consisting of net earnings and amortization & depreciation, indicating the internal sources of finance).
- Higher level of cash flow coverage reduces the bankruptcy risk, by increasing the level of function Z(M).
X4 – current ratio
Method of calculation
Ratio's weight: +0.455
Units: times
Remarks
The ratio is calculated like the current ratio available in the group of liquidity ratios. It uses the data for the current period.
Ratio's interpretation
- A higher value of the ratio means a higher level of liquidity and better financial situation, which reduces the risk of bankruptcy.
- In the model, the X4 ratio has a weight with a positive sign, which means that increase in the ratio, will increase the Z(M) function, reducing the bankruptcy risk.
X5 – productivity of assets (total assets turnover)
Method of calculation

Ratio's weight: +0.802
Units: times
Remarks
The ratio is partially calculated like the total assets turnover ratio available in the eanaliza.pl system in the group of efficiency ratios, but in the numerator we take the sum of operating revenues, i.e., positions A + D (in the comparative version of PaLS). It uses the data for the current period.
Ratio's interpretation
- A higher value of the ratio means greater efficiency of the company in generating revenues from its activities, which improves financial situation and reduces the risk of bankruptcy.
- In the model, the ratio X5 has a weight with a positive sign, which means that an increase in the ratio (higher efficiency) will increase the value of the function Z(M).
Based on:
MACZYNSKA E., ZAWADZKI, M. (2006). Dyskryminacyjne modele predykcji bankructwa przedsiębiorstw. Ekonomista 2, 205-235. (in Polish)