
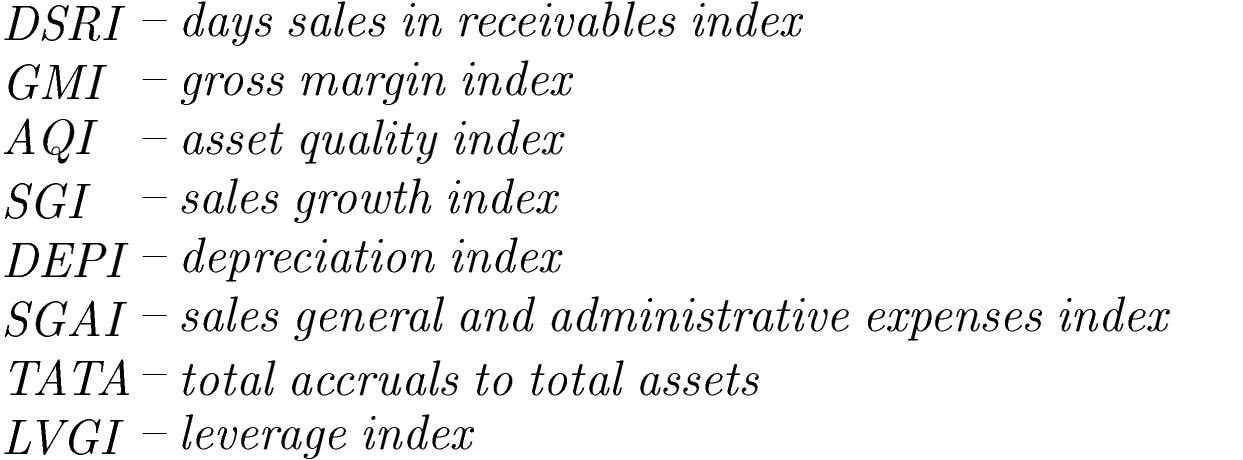
Model Beneisha (M-score) – 1999
Method of calculation

where:
Model description
The probit Beneish Model (M-score) is one of the most well-known method of detecting earnings manipulation.
Prof. M. D. Beneish from the Indiana University analyzed financial data of Amercian listed companies for 1982-1992. The sample included also firms that manipulate earnings.
The model uses three groups of ratios (variables):
- ratios illustrating the future performance of a company,
- ratios related to cash flows and accruals,
- ratios indicating the motivation of managers to manipulate financial data.
The original model includes eight variables (ratios). The variables are measured using data from the fiscal year of the first reporting violation (t) by comparing them to the prior year (t - 1). For each variable the coefficient was estimated.
Interpretation of the M-score
- M > -2.22 (-1.78) – the value above threshold indicates that there is likelihood of earnings manipulation. The value -1.78 results from the correction introduced in 2012.
- The model identifies correctly potential manipulators for:
- 76% cases in the first year after the earnings manipulation,
- 66% cases in the second year after the earnigns manipulation.
- Based on the analysis of the firms that manipulated earnings, Beneish noticed, that on average, manipulators have significantly:
- higher growth of sales,
- larger accruals,
- greater deterioration of gross margins and assets quality,
- larger increase in debt,
- larger increases in days sales in receivables.
- Notes on the interpretation and application of the model:
- the model assesses the likelihood of earnings manipulation and enables to classify firms as "manipulators" or "non-manipulators",
- for the model to be effective the company in period (t - 1) cannot manipulate the earnings, otherwise comparing data from two manipulated periods will give incorrect results
- individual ratios are only a signal of a potential manipulation, which may indicate further directions of detailed analysis (e.g. cost level analysis, analysis of the cause of changes in the level of sales and receivables),
- it should be checked whether there were any changes in the assumptions of the company's accounting policy in the analyzed period.
Detailed description of respective ratios and their impact on the M-score value
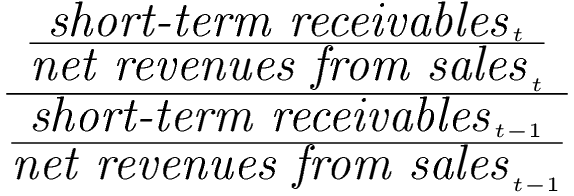
DSRI – days sales in receivables index
Method of calculation
Ratio's weight: +0.920
Units: times
Value for "manipulators": 1.412
Value for "non-manipulators": 1.030
Remarks
The value for the first period (first column in the table) is equal to the value for the current period (t), as the value for the previous period (t-1) is not available.
Ratio's interpretation
- DSRI is the ratio of days sales in receivable in the first year in which earnings manipulation is uncovered (year t) to the corresponding measure in year t - 1. This variable gauges whether receivables and revenues are in or out-of-balance in two consecutive years.
- Disproportionate increases in receivables relative to sales may be suggestive of revenue inflation.
- It is expected that a large increase in days sales in receivables is associated with a higher likelihood that revenues and earnings are overstated.
- However a large increase in days sales in receivables could be the result of a change in credit policy (it should be checked).
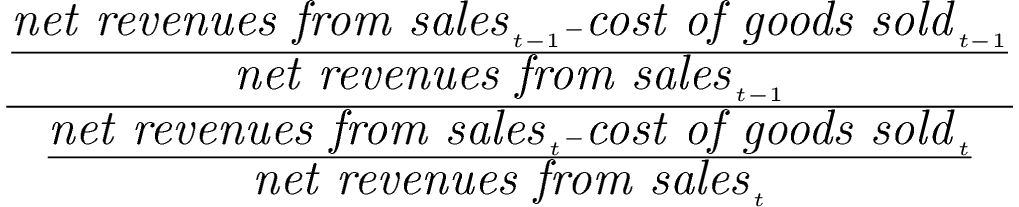
GMI – gross margin index
Method of calculation
Ratio's weight: +0.528
Units: times
Value for "manipulators": 1.159
Value for "non-manipulators": 1.017
Remarks
The value for the first period (first column in the table) is equal to the value for the current period (t), as the value for the previous period (t-1) is not available.
Ratio's interpretation
- GMI is ratio of the gross margin in year t - 1 to the gross margin in year t.
- When GMI is greater than 1, it indicates that gross margins have deteriorated.
- Firms with poorer prospects are more likely to engage in earnings manipulation, thus it is expected to be a positive relation between GMI and the probability of earnings manipulation.
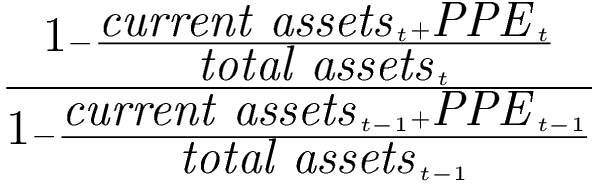
AQI – asset quality index
Method of calculation
Ratio's weight: +0.404
Units: times
Value for "manipulators": 1.228
Value for "non-manipulators": 1.031
Remarks
The value for the first period (first column in the table) is equal to the value for the current period (t), as the value for the previous period (t-1) is not available.
Ratio's interpretation
- AQI is the ratio of asset quality in year t, relative to asset quality in year t - 1.
- Asset quality in a given year is the ratio of non-current assets other than property plant and equipment (PPE) to total assets. It measures the proportion of total assets for which future benefits are potentially less certain.
- If AQI is greater than 1 it indicates that the firm has potentially increased its involvement in cost deferral, thus it is expected to be a positive relation between AQI and the probability of earnings manipulation.
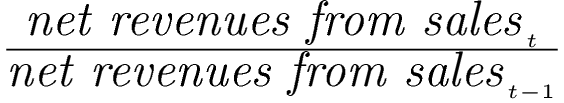
SGI – sales growth index
Method of calculation
Ratio's weight: +0.892
Units: times
Value for "manipulators": 1.581
Value for "non-manipulators": 1.133
Remarks
The value for the first period (first column in the table) is equal to the value for the current period (t), as the value for the previous period (t-1) is not available.
Ratio's interpretation
- SGI is the ratio of sales in year t to sales in year t - 1.
- It is expected to be a positive relation between SGI and the probability of earnings manipulation.
- For SGI greater than 1, the likelihood of earnings manipulation is higher.
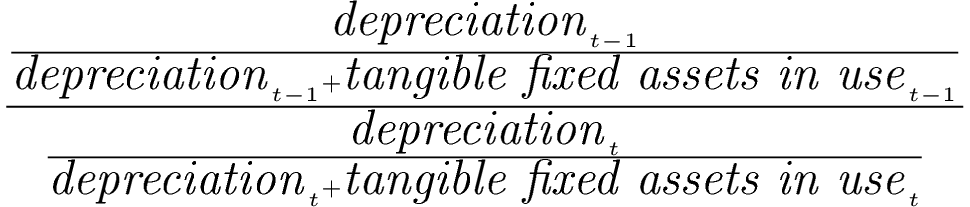
DEPI – depreciation index
Method of calculation
Ratio's weight: +0.115
Units: times
Value for "manipulators": 1.072
Value for "non-manipulators": 1.007
Remarks
The value for the first period (first column in the table) is equal to the value for the current period (t), as the value for the previous period (t-1) is not available.a
Ratio's interpretation
- DEPI is the ratio of the rate of depreciation in year t - 1 versus the corresponding rate in year t.
- A DEPI greater than 1 indicates that the rate at which assets are depreciated has slowed down - decreasing operating costs and increasing net profit.
- It is expected to be a positive relation between DEPI and the probability of manipulation.
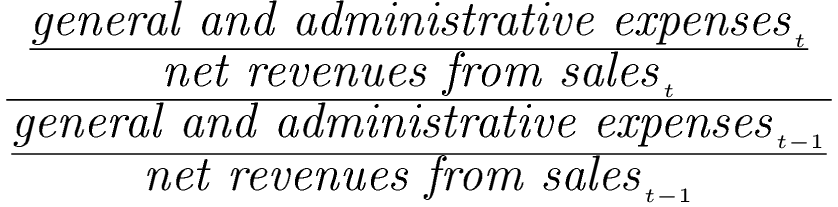
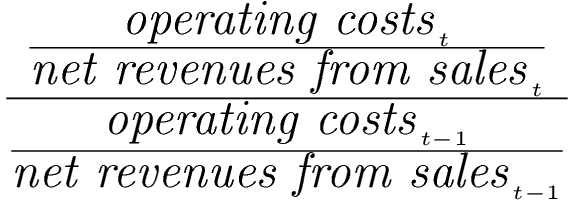
SGAI – sales general and administrative expenses index
Method of calculation
or
Ratio's weight: -0.172
Units: times
Value for "manipulators": 1.107
Value for "non-manipulators": 1.085
Remarks
The first formula applies to the calculation version of PaLS. In the comparative version, since the numerator elements are not available, we assume the second formula.
The value for the first period (first column in the table) is equal to the value for the current period (t), as the value for the previous period (t-1) is not available.
Ratio's interpretation
- SGAI is calculated as the ratio of SGA to sales in year t relative to the corresponding measure in year t - 1.
- A disproportionate increase in SGA is regarded as a negative signal about firms future prospects.
- It is expected to be a positive relation between SGAI and the probability of manipulation.
- SGAI greater than 1 increases the likelihood of manipulation.
TATA – total accruals to total assets
Method of calculation

or

Ratio's weight: +4.679
Units: times
Value for "manipulators": 0.049
Value for "non-manipulators": 0.015
Remarks
The value for the first period (first column in the table) is equal to the value for the current period (t), as the value for the previous period (t-1) is not available.
Ratio's interpretation
- Total accruals are calculated as the change in working capital accounts other than cash less depreciation.
- Total accruals to total assets is used to proxy for the extent to which cash underlies reported earnings.
- It is expected that higher positive accruals (less cash) are associated with a higher likelihood of earnings manipulation.
LVGI – leverage index
Method of calculation
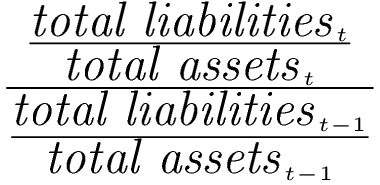
Ratio's weight: -0.327
Units: times
Value for "manipulators": 1.124
Value for "non-manipulators": 1.033
Remarks
The value for the first period (first column in the table) is equal to the value for the current period (t), as the value for the previous period (t-1) is not available.
Ratio's interpretation
- LVGI is the ratio of total debt to total assets in year t relative to the corresponding ratio in year t - 1.
- LVGI captures debt covenants incentives for earnings manipulation.
- LVGI greater than 1 indicates an increase in leverage and higher likelihood of manipulation.
Based on:
BENEISH M.D. (1999), The Detection of Earnings Manipulation, "Financial Analysts Journal", vol. 55, no. 5.
BENEISH M.D., LEE C.M.C., NICHOLS C. (2012), Fraud Detection and Expected Returns, Working Paper, Indiana University Bloomington.
DALECKA A. (2015) Użyteczność modelu Beneisha w detekcji manipulacji księgowych, "Finanse, Rynki finansowe, Ubezpieczenia" nr 73, t. 1. (in Polish)